coding, graphics, and data portfolio
Bayliss Wagner
Interactive Restaurant Guide, The Philadelphia Inquirer
description:
An interactive restaurant guide that allows users to browse around 25 vegan & gluten-free restaurants by neighborhood and filter the list by dietary restriction.
my role & what i learned from this project:
On the development side, I used Javascript, HTML, and CSS to design and developed the mobile, tablet and web user interfaces. To streamline the large amount of copy and data we kept, I also created a backend for the project that connects Node.js to Google Drive documents. On the editorial side, I worked with another intern to pitch, research, vet, photograph and write the copy about the restaurants. Throughout every stage of this project I incorporated feedback from my editor on the guide’s design as well as feedback from the editor of the Food section, as well as feedback from user testing, I conducted with the team. The project has not yet been published, but it can be found at the 'live page' link below.
Live New Jersey & Delaware Beaches Map, The Philadelphia Inquirer
description:
This interactive shore guide allows users to explore dozens of NJ and DE beaches and see in advance of a trip whether beaches are closed, open or under advisory and for what reasons. In addition, users can check the weather and get driving directions to each of these beaches, which are displayed on a map.
my role & what i learned from this project:
I talked with state environmental control officials, lifeguards, and beach patrol directors to fact-check and find context for the data. This information went into the explanatory copy for the guide. I then used Python web-scraping and data-processing libraries to create a function that would scrape the data for Delaware beaches from its website and feed it into the web page, live, every hour, and input it cleanly into the existing framework for the project. I performed multiple phases of user testing to make sure the design was as user-friendly as possible and to ensure we caught all bugs before we launched the project.
Survey: Awaiting Fall 2020 plan, students face housing uncertainty, safety concerns, The Swarthmore Phoenix
description:
A fellow reporter and I conducted a survey of Swarthmore students to gauge students’ enrollment plans for fall 2020 as well as challenges they faced during the pandemic, with data visualizations and breakdowns.
my role & what i learned from this project:
In addition to sharing the writing and reporting with my partner, I designed the article layout and all graphical elements, which included numerous analyses & visualizations of survey data, featured quotes, and bulleted 'findings' sections. Used custom HTML embeds in Wordpress to edit design.
My personal website (hint: you're on it now)
description:
I coded the site by extensively modifying a free template and installed a Gulp development system that uses nunjucks for templating & browser-sync for live dev.
Novel Data Parser
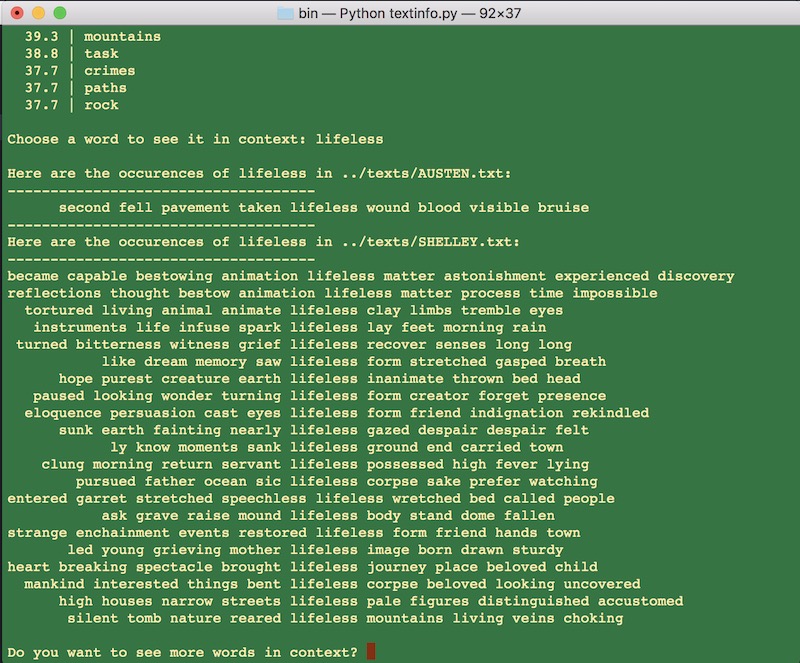
description:
This Python file, created for a Digital Humanities assignment, takes single novels or a corpora of novels as input. The user can choose novels from these files and compare them. The program displays "most frequent words" in each novel and "most distinctive words" in each through comparison. The program also displays the "context" (surrounding words) of any word in the novel. (Ex: input "love" will display every use of the word "love" in the novel). I experimented with removing different stopwords when we returned to this program for my English class.